
Back in December 2015 I spoke at LDNWebPerf alongside Peter Chamberlin about how web performance is not a technical problem (slides with speaker notes). One of the things I talked about was how we used multivariate testing (MVT) at BBC News to prioritise performance optimisations. The gist of it was that our stakeholders had already bought into the idea that performance has a strong correlation to business metrics, and they wanted to dedicate some development time to improving performance. The catch was that they didn’t want to spent too much time on it.
Our predicament, then, was that we needed to know which optimisations had the biggest impact on performance without actually spending the time to make the optimisations. For example, we had a hunch that inlining the critical rendering path CSS would improve our start render time, but with over 1MB of CSS and a complicated application architecture, implementing this was much easier said than done.
This is where the idea to A/B test performance came from: we could easily make the performance optimisations by hand on a single page, and then benchmark each of the optimisations to find out which had the biggest impact.
The method
Setting up A/B tests for performance is much simpler than you might think — all you need is a page to use as the baseline, a page for each optimisation, and a consistent way to measure performance.
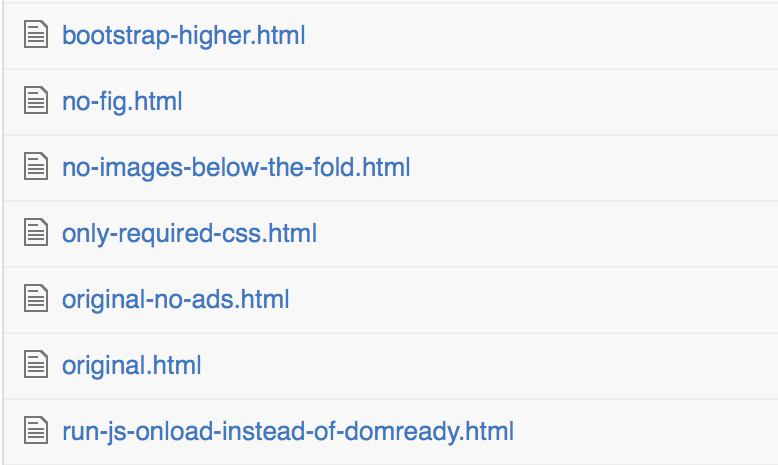
We took a snapshot of the BBC News front page to use as the baseline, and made a variation of that snapshot by hand for each performance optimisation. The focus of this post isn’t the optimisations themselves, but to give some context, they were things like:
- Lazy loading images below the fold.
- Delaying JavaScript execution until after the content has rendered.
- Removing unused CSS.
- Loading adverts asynchronously.
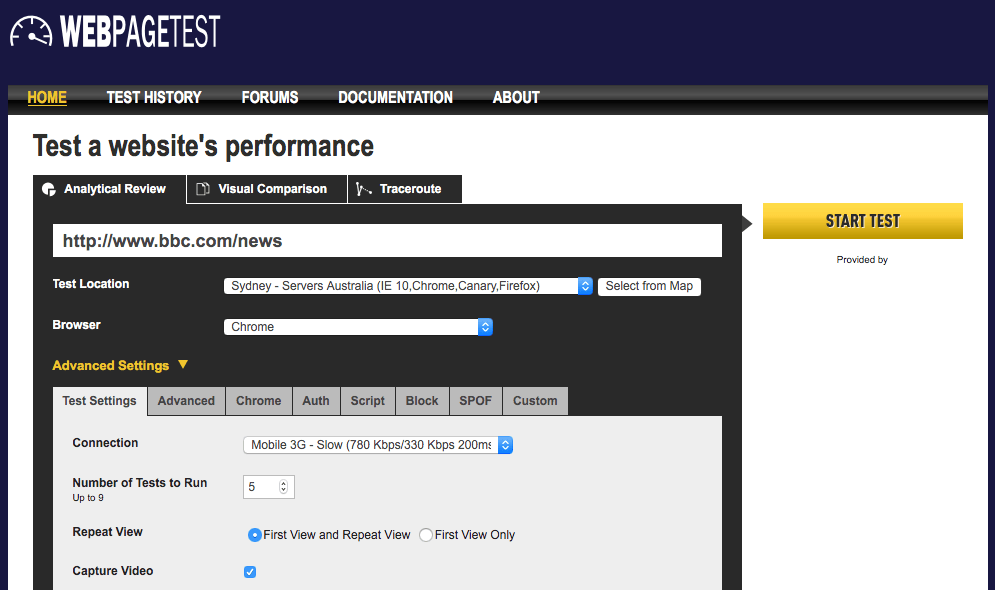
We deployed these optimised variations alongside the baseline, and used WebPagetest to benchmark their performance. If you’re not familiar with WebPagetest, it’s a really useful tool to have in your web performance toolkit. It loads a page in real web browsers and records information about its performance. It has a bunch of useful features like connection throttling, video capture, and also lets you script interaction with the page.
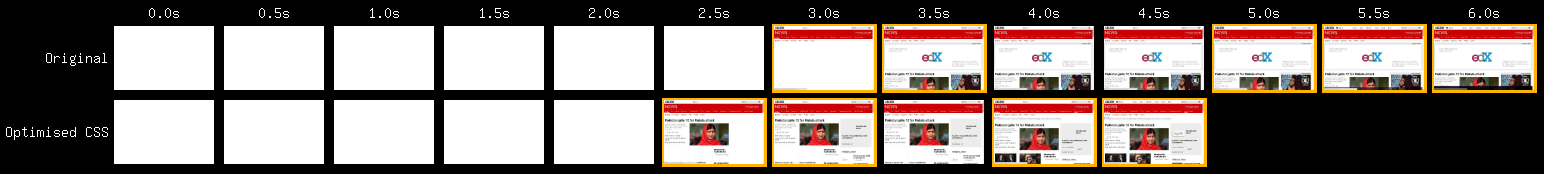
One of the other features that WebPagetest offers is the ability to visually compare two pages. We used this a lot while we were benchmarking the variations because it’s great way to show the impact of optimisations to non-technical stakeholders.
Interpreting the results
Interpreting the results of A/B tests is usually very circumstantial and requires some forethought about your own goals and circumstances. Our goal was to identify which performance optimisations gave us the largest improvement to start render time relative to how long they took to implement. We chose this goal because data from our real user monitoring (RUM) suggested there was a strong correlation between start render time and business metrics like bounce rate, session length, and pages per session. Your goal will likely be completely different.
To simplify the decision making process, we came up with a scoring system that works by multiplying the improvement to start render time by a difficulty rating:
| Optimisation | SR improvement (ms) | Difficulty (1 = hardest; 10 = easiest) | Score |
|---|---|---|---|
| Only load JS required for page | 250 | 8 | 2000 |
| Only load CSS required for page | 1000 | 2 | 2000 |
| Remove blocking scripts from <head> | 1500 | 1 | 1500 |
| Lazy load images below the fold | 80 | 10 | 800 |
It’s by no means a perfect system, but it did help us to prioritise the optimisations. There are many other factors that come into play, for example lazy loading images is one of the first optimisations we made, despite it having a low score. The rationale behind this was that it was very easy to do and had a noticeable real-world benefit: it reduced the amount of data for users on mobile connections.
Validating the results
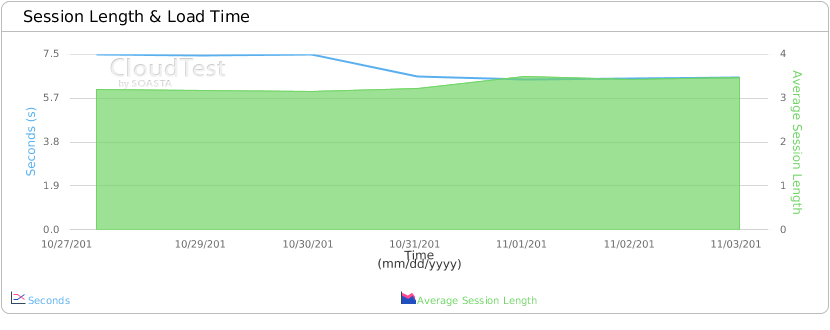
The final part of an A/B test is to validate whether the variants had the predicted impact in real world conditions. For performance optimisations, this is best done using real user monitoring like SpeedCurve LUX or SOASTA mPulse. However synthetic testing tools like WebPagetest can also work to validate your optimisations.
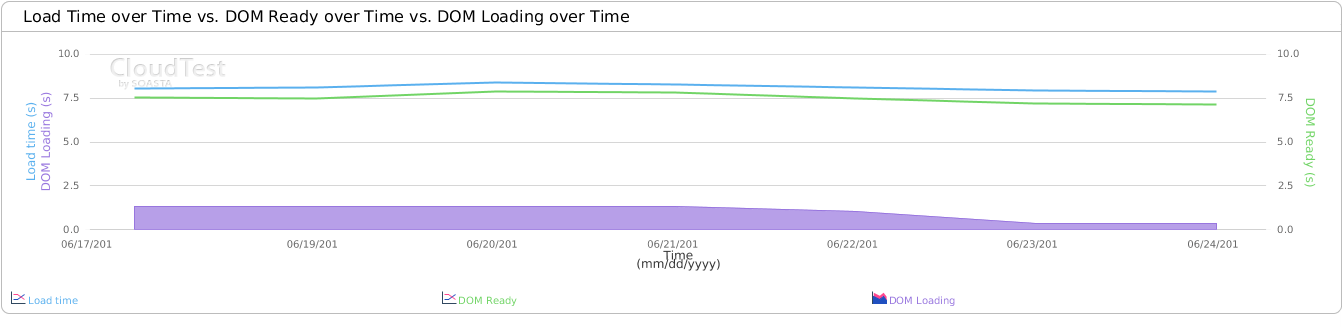
We plotted our performance and business metrics around the time that our optimisations were deployed, and (thankfully) saw the results that we expected.
Wrapping up
Taking the time to A/B test performance optimisations can help your team prioritise work and ensure that you don’t waste time making optimisations that have no impact. You don’t need to use complex or expensive software to get meaningful results from your tests — it’s probably sufficient to make optimisations by hand and measure the results using free software like WebPagetest or your browser developer tools.