
Most of the English-speaking world has Amazon and eBay. In New Zealand we have TradeMe - an online auction & classified advert website where Kiwis go to buy & sell general items, cars, and property. If the numbers are to be believed, then pretty much every Kiwi has a TradeMe account. I don’t think it’s an understatement to say that TradeMe is an itegral part of modern New Zealand culture.
Back in 2016, TradeMe announced that it was working on a new “smartphone-optimised” responsive website that will eventually also replace the desktop website. Then halfway through 2018, they announced that the new responsive website was being rolled out to real users.
Being the ever-curious developer, I wanted to give the new TradeMe website a try. After a couple of weeks using the new website on my phone (a Nokia 7 Plus), I became frustrated with how much time I spent staring at a loading spinner, and how sluggish the UI interactions were. So I went back to the old website.

This bothered me, because I know that the other TradeMe experiences are fast. Why should this new website be so slow? I wanted to dig deeper, so I’ve taken the opportunity to conduct a detailed performance review.
- Defining the test parameters
- The benchmark
- Identifying performance bottlenecks
- Some performance experiments
- Causes for celebration 🎉
- Recommendations
- Wrapping up
Defining the test parameters
One of the first things I like to do when I’m assessing the performance of a website is set a benchmark – what do users expect from this website? In most cases it makes sense to use a competing website as the benchmark. When we were improving the performance of BBC News, we used The Guardian and Financial Times as our benchmark because they are two of the fastest websites in the industry. However, it isn’t fair to use eBay or Amazon as a benchmark for TradeMe because they are both multi-billion dollar companies with thousands of developers. Instead, I’m using the much older (but much faster) TradeMe Touch website as a benchmark.
The next thing I like to do is find some performance metrics that are representative of the user experience. Given that TradeMe is mostly used by buyers (as opposed to sellers), I focused on visual completeness (when can I see the thing I’m trying to buy?) and interactivity (when can I scroll and place a bid?). Both of these things are very easy to measure with WebPageTest:
- I measure visual completeness by looking for the point at which the primary image is loaded using hero element times (which are currently hidden behind the heroElementTimes flag).
- I measure interactivity by using WebPageTest’s Time to Interactive metric, which is calculated as the point when the main thread has not been blocked for 5 seconds.
The final parameter is the test configuration. I wanted to emulate the performance of a mid-range smartphone on a mobile data connection, so for all of these tests I used the following WebPageTest configuration:
- Test Location: Sydney, Australia - EC2
- Browser: Chrome
- Connection: 3G (1.6 Mbps/768 Kbps 300ms RTT)
- Emulate Mobile Browser: iPhone 6/7/8
- CPU Throttling: 2.6 (specified using the throttle_cpu flag)
I ran all of these tests through SpeedCurve, which uses WebPageTest under the hood. I did this because SpeedCurve simplifies the process of running multiple tests and comparing data across different page variations. It also has some nice charts & views that make it easier to interpret the data.
The benchmark
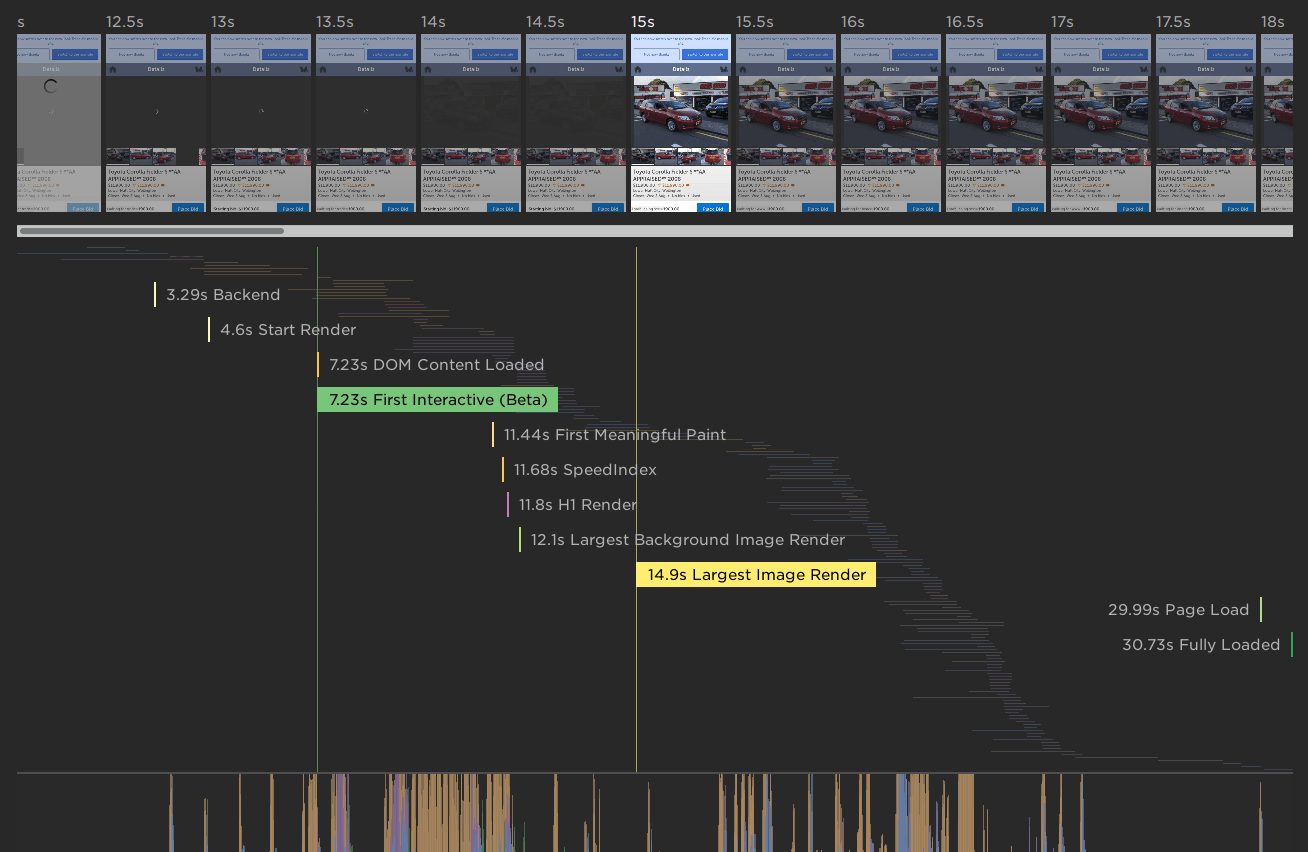
First up is the old TradeMe Touch website. In the screenshot below, you can see two metrics are highlighted: First Interactive and Largest Image Render. The page is considered interactive at 7.2 seconds, and the primary image is rendered at 14.9 seconds. The interactive time is not bad for a mid-range mobile device, but having to wait nearly 15 seconds to see the primary content is not something that most users will be happy about. I know I said that I wouldn’t compare TradeMe to its better-resourced international competitors, but just for reference: a similar page on eBay renders the primary image at 5.3 seconds.
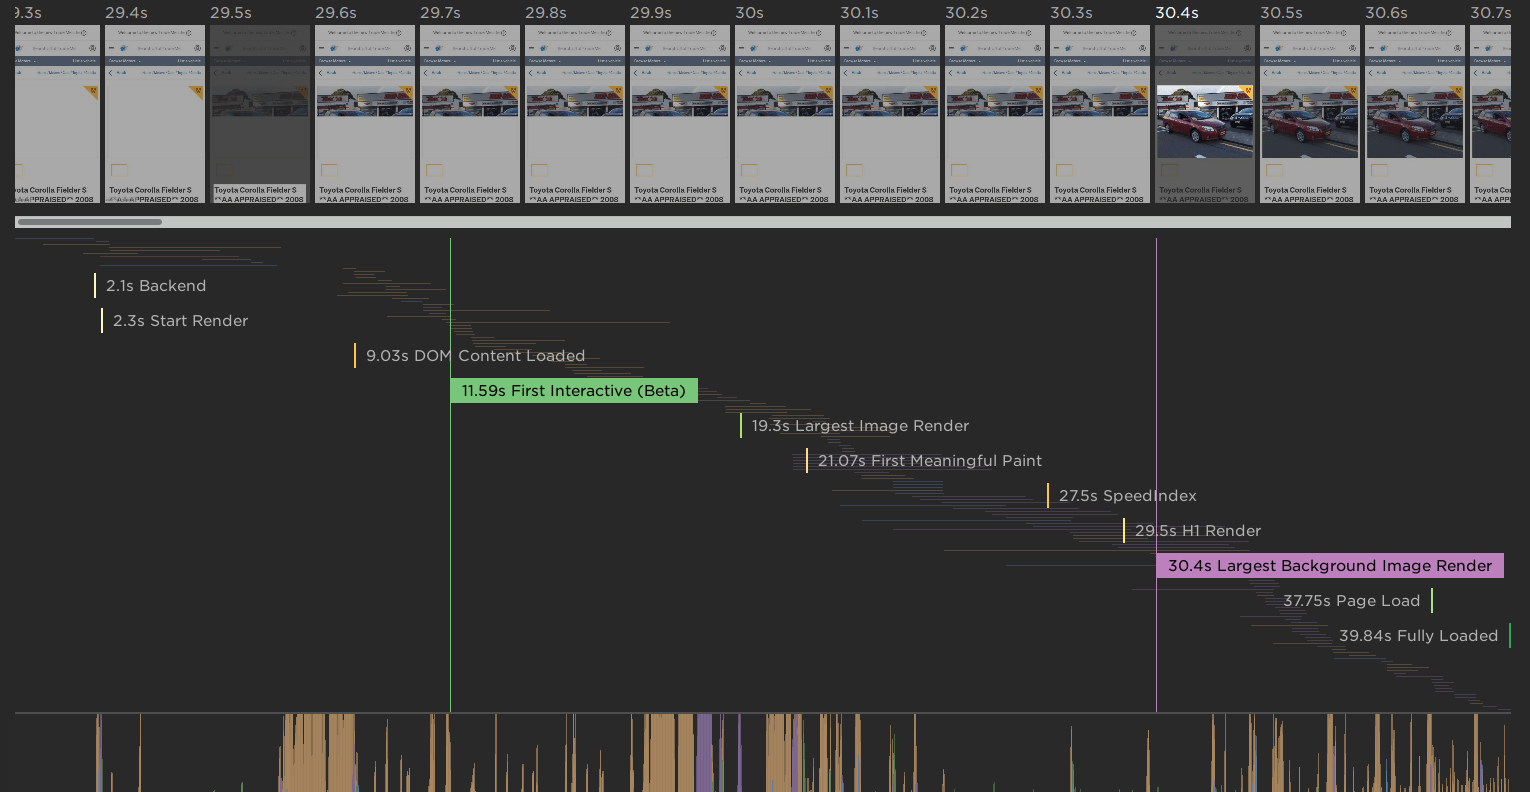
Now let’s see how the new website performs: interactive at 11.6 seconds, and the primary image is rendered at 30.4 seconds. No wonder I felt frustrated using this new website! On the bright side, there’s plenty of good performance lessons we can learn from this review. So let’s dig a bit deeper.
Identifying performance bottlenecks
Main thread activity
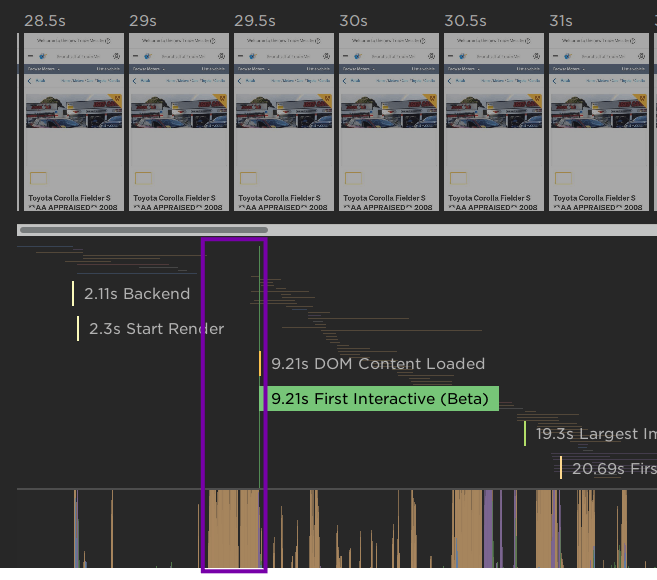
The first thing that draws my eye is this 2-second slice where the main thread is busy evaluating JavaScript. During these 2 seconds, the browser is doing nothing else. No layouts, no painting, not even any network requests.
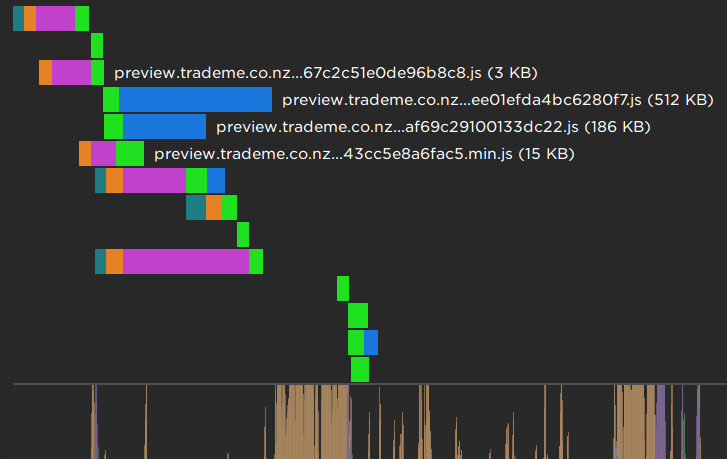
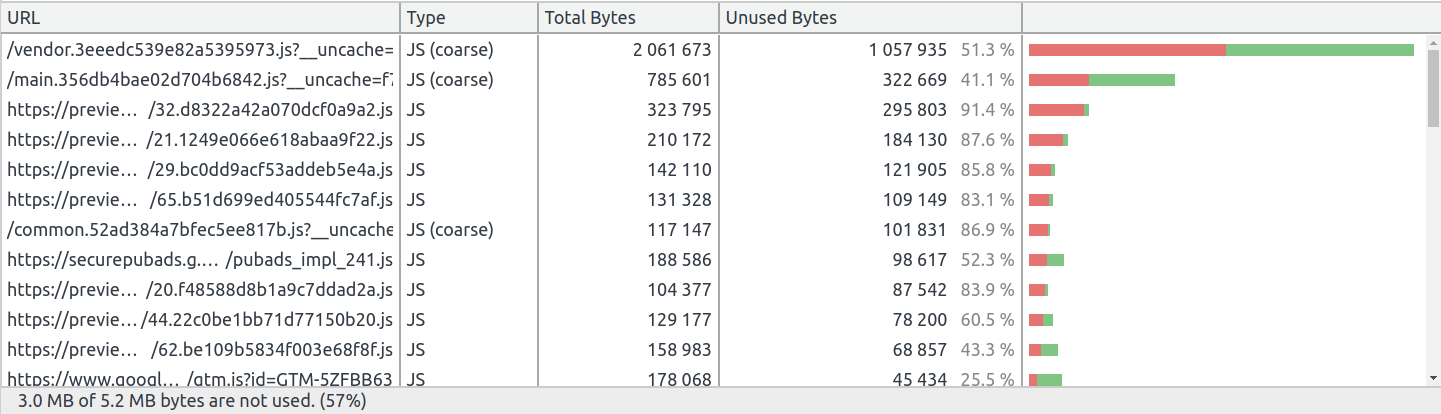
When I open the network view, it’s obvious what’s causing this: the browser is evaluating the 716KB of JavaScript that it just downloaded. This number is the bytes that were sent over the network, and doesn’t represent the true cost of this JavaScript. Once uncompressed, these JavaScript files weigh in at over 2.7MB. (Tip: in the Network tab of Firefox DevTools, you can choose to show both the “Transferred” and “Size” columns so that you can see both the bytes over the wire and the raw uncompressed resource size).
This 2 second period is just the tip of the iceberg. By the time the page has finished loading, over 2.2MB of JavaScript has been downloaded. This expands to more than 5.1MB of uncompressed code that the browser must parse, compile, and execute. According to the Coverage tool in Chrome DevTools, 3MB of this code is never even executed during the page load.
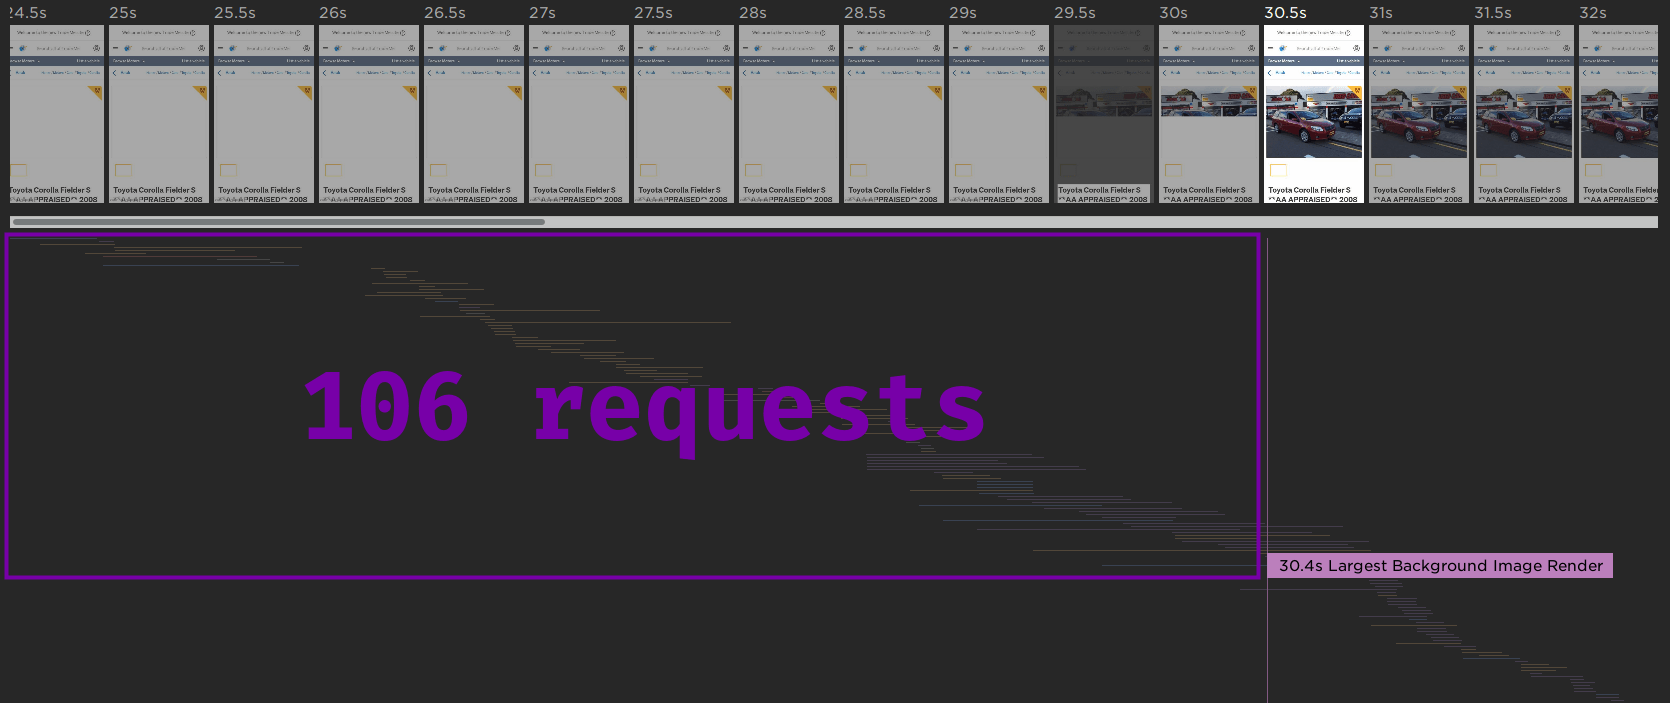
Delayed primary image request
The second thing that draws my attention is that the network request for the primary image does not even start until the 30 second mark. It’s request #107, out of 195 total requests. 17 other large images are downloaded before the primary image, which quickly uses up the limited bandwidth of this simulated mobile connection.
Some performance experiments
Looking at waterfall charts and dissecting JavaScript bundles is interesting, but what we really want to get out of a performance review is a list of actionable tasks with a rough estimate of how each task will impact the performance of the website. One of my favourite ways to get this list is by running some A/B performance tests by making some optimisations by hand and measuring their impact.
Prioritise loading the primary image
One of the obvious bottlenecks is the primary image being downloaded so far through the page load. We can improve the user experience by prioritising the primary image. I simulated this optimisation in two steps:
- Prime the cache for the primary image. While this is not strictly possible in the real world, the effect should be similar to using
<link rel=preload>to request the primary image as soon as possible. - Block all of the other image requests so that the primary image isn’t contending for network bandwidth.
Here are the results:
| Metric | Original | Optimised | Difference |
|---|---|---|---|
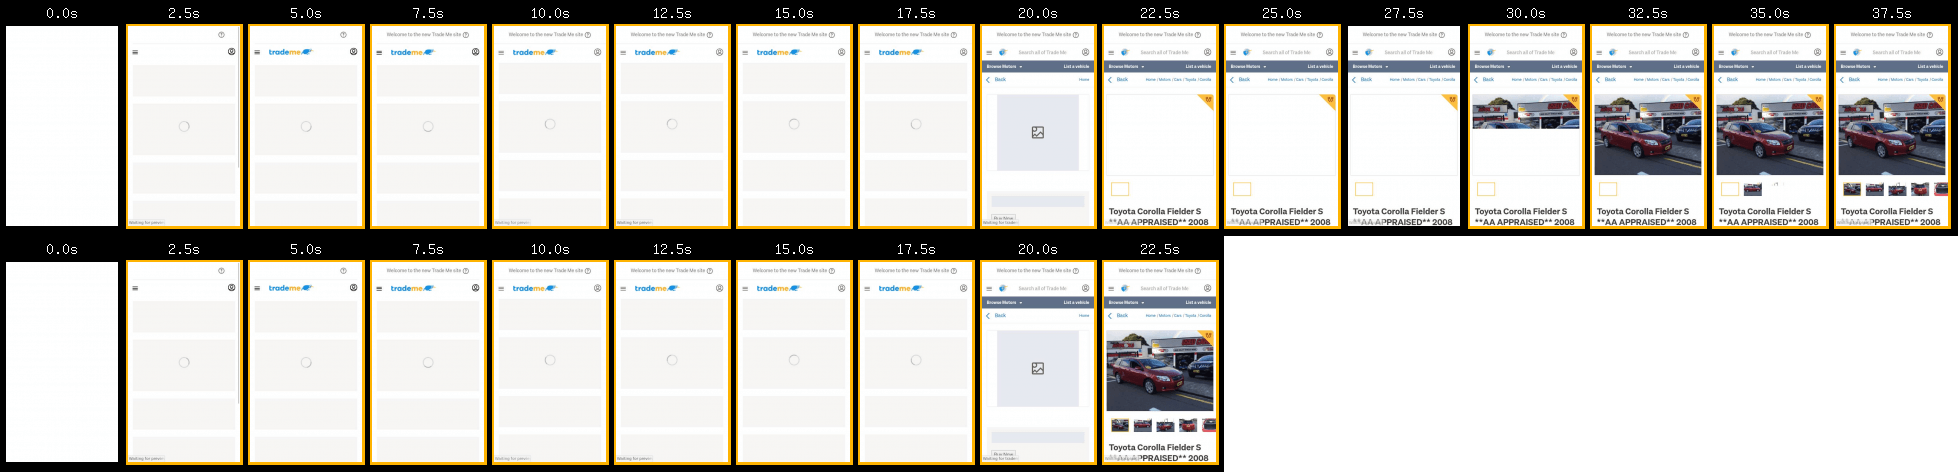
| Primary image render | 30.4s | 21s | 9.4s (30%) |
Viewing the filmstrip of the original page versus the optimised page really shows how much faster this is:
Defer loading third party assets
While the majority of the blocking assets belong to TradeMe, there is still a considerable amount of third party content being downloaded – about 350KB, most of which is JavaScript. Deferring this third party content until later in the page load could improve the user experience by prioritising the first party content.
I simulated this optimisation by blocking requests from all third party domains. Here are the results:
| Metric | Original | Optimised | Difference |
|---|---|---|---|
| First Interactive | 11.6s | 9.5s | 2.1s (18%) |
Render page content on the server
Unfortunately the new TradeMe site neither works without JavaScript enabled, nor does it work offline despite utilising a caching service worker. One reason for this is that the page content is fetched and rendered by JavaScript rather than being contained in the initial document response. Rendering some basic content on the server not only enables the page to be used offline or without JavaScript, it also has significant performance benefits since the browser can begin to render content well before it has finished downloading the other page resources.
I simulated this optimisation by creating a static version of the page with the content pre-rendered. I also moved the <script> tags to below the main content to prevent them from blocking rendering. Since this version ran in a different environment, I adjust the numbers to account for the difference in backend times. Here are the results:
| Metric | Original | Optimised | Difference |
|---|---|---|---|
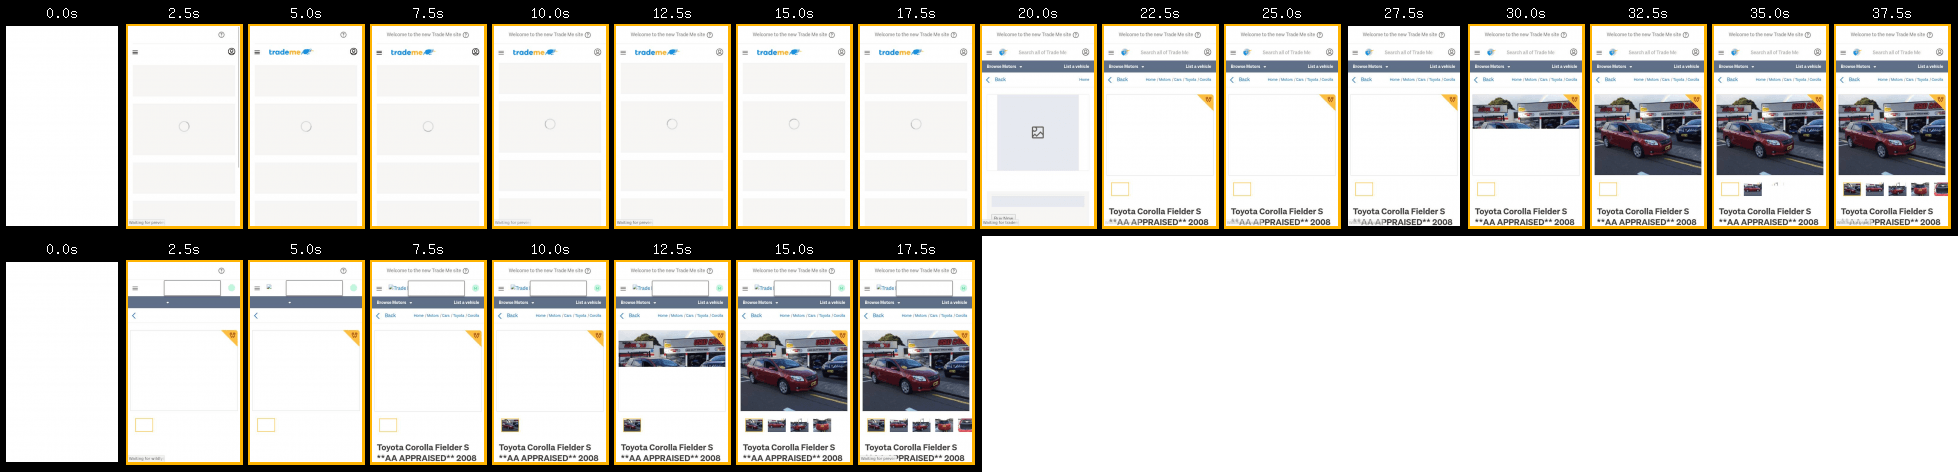
| Heading render | 21.2s | 5.7s | 15.5s (73%) |
| Primary image render | 30.4s | 11.7s | 18.7s (61%) |
Like the primary image optimisation test, viewing the filmstrip of the original page versus the optimised page shows how much impact this optimisation really has.
Note that First Interactive is not comparable for this test, since I changed the position of the <script> tags.
Causes for celebration 🎉
It’s far too easy in a performance review to focus on the things that a website gets wrong. I always like to try and find some things that a website is doing right.
Caching improves the experience on repeat visits
On the first page load, over 4.2MB of data is transferred. On subsequent page loads, that number is more like 570KB thanks to a caching service worker and sensible caching headers.
Code splitting is already implemented
Despite the massive bundle size, it looks like code splitting has already been implemented. Code splitting is recommended to ensure that your users only download the code that they need. Code splitting can be hard, but the fact that it is already set up on TradeMe should reduce the amount of effort required to optimise the JavaScript delivery.
Recommendations
Test on representative devices and networks
Building great user experiences requires a large dose of empathy, and one of the easiest ways to get this empathy is by using your product in the same way that your users do. Pick up a mid-range Android phone or an Intel Celeron laptop and see how your product feels on those devices. The great thing about using the same devices as your users is that they are cheap - often 10-20x cheaper than the MacBook Pro used by many developers.
Render the core content on the server
I’ve always been an advocate for having a good core experience. If you’re not familiar with the concept of a core experience, I define it as follows:
A core experience should be made up of these five things, in order of importance:
- The page content.
- The markup required to make the page accessible.
- Minimal styling to make the content easily readable – grids, typography, etc.
- Minimal styling to brand the page – logo, colours.
- The means to enhance the page where appropriate.
A core experience should be just these things. Everything else is an enhancement.
This might sound familiar if you know about progressive enhancement, since having a core experience is a prerequisite for doing any progressive enhancement.
Not only does a good core experience enable users to view your product on practically any device or browser, it can also be hugely beneficial to page performance. TradeMe is a perfect example of this, with my experiment showing a 15-19 second reduction in the time to render core content.
Preload important resources
Even though browsers are becoming smarter and better at loading your page resources, they lack the context required to know which resources are the most important to your users. Thankfully, developers can give the browser some hints using <link rel="preload"> to kick-start the loading of certain resources. This is a great way to speed up the loading of primary images and dynamic content. As well as preloading resources, the upcoming Priority Hints API will give developers the ability to set an importance flag on resources.
Reduce the amount of JavaScript you ship
JavaScript is a hot topic in 2018. It is by far the biggest contributor to slow user experiences on the web – if you haven’t already read Addy Osmani’s The Cost Of JavaScript in 2018 then I would recommend doing so.
In the last few years, the web developer ecosystem has come leaps and bounds. With tools like npm and Webpack, it’s easier than ever before to create interactive user experiences and bundle them up to be delivered on the web. An unfortunate downside to this is that it’s easier than ever before to create huge JavaScript bundles that don’t perform well.
Right now there are no easy answers to The JavaScript Problem. The best thing that developers can do today is to remain diligent and balance ease of development with user experience.
Use performance budgets
Before you even start working on a project, set yourself budgets on key user experience metrics like First Interactive, Hero Element Render Time, and JavaScript bundle size. Keep an eye on your budgets and always fix problems that break your budgets. Performance budgets are becoming a de facto feature of performance monitoring tools. We used SpeedCurve’s performance budgets at the BBC to set performance targets and receive alerts when we broke the budgets.
Wrapping up
I hope this has been a useful insight into how I conduct performance reviews. I’ll be doing more of these in the future, so if there’s a part of the review that you think I should focus on more, or a particular website that you’d like me to review, let me know!